Mastering Your Message: The Practical Power of the Four Steps Infographic Rectangle
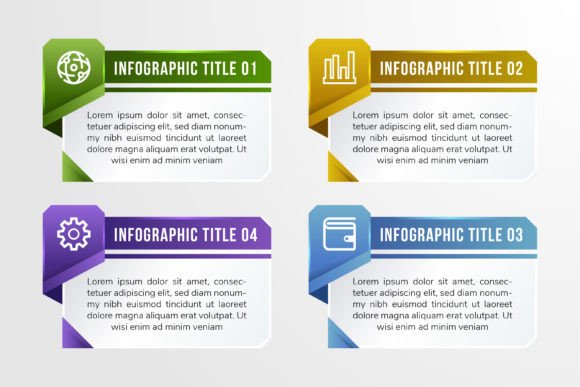
When you need to communicate a process, strategy, or a clear progression of ideas, the Four Steps Infographic Rectangle template is a formidable tool in your arsenal. This modern design, featuring a clean linear diagram with vibrant gradient colors—green, gold, blue, and purple—is more than just a graphic. It's a structured communication framework. People are drawn to it because it promises clarity: a simple, visually appealing way to break down complex business concepts like development cycles, marketing strategies, or project plans into digestible stages. However, its true value isn't just in its download folder containing AI, EPS, JPG, and SVG files. That value is unlocked only when you avoid the common pitfalls that turn a powerful visual aid into a confusing or generic slide.
The Overlooked Foundation: Defining Your Core Process
A prevalent mistake is rushing to populate the template's four rectangles with text before fully defining the actual process. You might see the four inviting icons and placeholder headings and immediately start typing "Planning," "Execution," "Monitoring," "Review." While logical, this generic sequence often doesn't match your unique workflow. The infographic becomes a superficial decoration rather than a true reflection of your business logic. This affects audience understanding; they see a pretty diagram but don't gain insight into your specific strategy or project phases.
The corrective approach is simple but critical. Before opening the editable vector file, write out your process in plain sentences. Ask: "What are the four *irreversible* stages? Does step three truly depend on step two being complete?" For a startup launch, your four steps might be "Market Validation," "Prototype Development," "Seed Funding Pitch," and "Beta Launch." This specificity transforms the template from a stock graphic into a custom communication tool. Always check that your four steps represent a mandatory sequence, not just a collection of four related topics.
Misusing Color and Iconography
The template's multicolor gradient is aesthetically pleasing, but its purpose is functional. A common misunderstanding is treating the green, gold, blue, and purple simply as decoration. In a well-designed process infographic, color can guide the eye and signify progression or category. Misusing it—perhaps by changing colors randomly or making all rectangles the same hue—diminishes the visual logic. Similarly, selecting icons based on what "looks nice" rather than what semantically matches your step content creates cognitive dissonance. An icon of a gear for a "Customer Feedback" stage, for example, is confusing.
Use the color gradient intentionally. Let the color transition (e.g., from green to purple) visually reinforce the journey from start to finish. Keep icon choice disciplined. If your first step is "Data Analysis," use a chart or graph icon, not a lightbulb. The provided vector files allow easy editing, but that flexibility demands thoughtful decision-making. Before finalizing, review your graphic as if you were a viewer with no prior knowledge: does the color flow and icon choice intuitively support the text headings? This attention to detail dramatically increases the infographic's communication efficiency.
The Resolution Trap: Assuming 300dpi Means "Ready for Everything"
The product description highlights high resolution (300dpi) and 100% vector graphics. Many buyers assume this automatically means the graphic is optimized for all use cases, from web banners to printed posters. This isn't a mistake of the template, but a user oversight. While the vector EPS and AI files are infinitely scalable, the included JPG is a raster image at a set resolution. Using that JPG for a large-format print without verifying its actual dimensions (in inches or centimeters) at 300dpi can result in a blurry, pixelated output that undermines your professional presentation.
The practical advice is to understand the difference between file types. For digital use (websites, PowerPoint), the SVG or JPG files are typically perfect. For any physical print, always use the native vector files (AI or EPS) with your design software to set the exact output size you need. This ensures the crisp, professional quality the template is capable of. Before you download and use the asset, confirm your final medium and plan which file format you will edit and export from.
Skipping the Narrative: Presenting Steps Without Connection
The Four Steps Infographic Rectangle can sometimes be presented as four isolated boxes, leaving the audience to infer the connection between them. The linear layout suggests sequence, but the why of the sequence is often missing from the final layout. For instance, a graphic showing "Ideation," "Design," "Build," "Launch" doesn't communicate the feedback loops or decision gates that might exist between "Design" and "Build." This oversimplification can lead to misalignment in team projects or stakeholder expectations.
A better approach is to use the infographic as the central visual, but augment it with supporting text that explains the transitions. In your presentation or document, add a brief sentence below or beside the graphic explaining the critical action or outcome that moves you from one step to the next. For example, under the arrow between "Design" and "Build," you could note: "Finalized prototype and budget approval triggers development phase." This turns a static diagram into a dynamic storyboard of your business process. Check that your final deliverable doesn't just show the steps, but also hints at the criteria for progression.
The template is a fantastic resource for creators, educators, and marketers. Its well-organized, editable nature means you can adapt it to countless scenarios. By avoiding these common errors—failing to define your unique process, misapplying its visual elements, misunderstanding file formats, and neglecting the connective narrative—you ensure this tool enhances comprehension and engagement. Your end result will be a professional, clear, and effective visual that does more than just look good; it communicates your idea with authority and clarity. Remember, the best graphics are those where the design serves the message, not overshadowing it.